
US - 2025 Traffic Events (Updated)

Price the Route, Not the Zip Code

The US 2025 Traffic Events dataset brings over 104 million telematics-grounded records into a road-segment-level risk scoring layer built for UBI underwriting and commercial fleet analytics. For the first time, your models can price the exact intersection, curve, or on-ramp where risk clusters, not the territory it happens to fall inside.
At a Glance

The Data Behind the Decision

104,218,698
Traffic event records available
Road-segment
Risk scoring granularity
2025
Current-year data vintage
Buy by Geography

Stop buying the whole country. Buy just your markets.

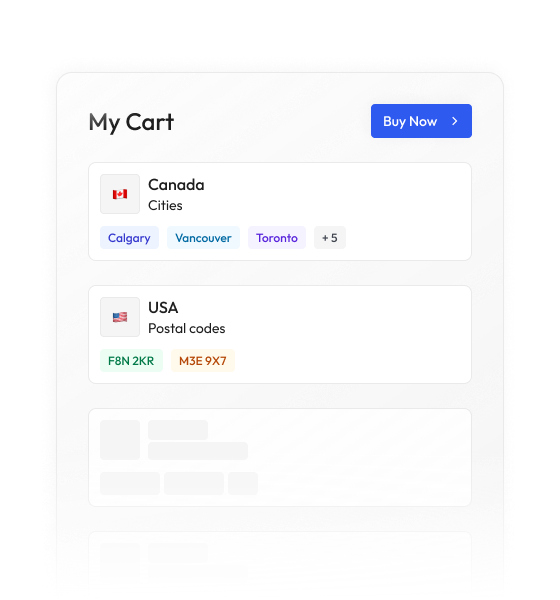
Most data vendors sell you a national license to millions of records you will never contact. BigGeo works differently.You tell us where you sell, and we cut you exactly that geographic slice of the dataset. A single city.

A cluster of ZIP codes. A metro area. A county. Whatever matches your territory. The result is a lean, CRM-ready file containing only the companies in the markets you actually work, delivered at a fraction of the cost of a full national license.
Book a Meeting

See the Risk Signal in 30 Minutes

The Problem

Zip Codes Are Lying to Your Actuaries

Usage-based insurance promised precision pricing. What most carriers got instead was telematics data feeding the same coarse territory models that existed before GPS existed. The signal is in the road. The models are in the zip code. That gap is where margin leaks.

filter_alt
Territory-level risk dilution
Aggregating telematics events to zip-code or territory boundaries buries the micro-location signal that separates a safe commuter from a high-risk corridor driver. You are pricing groups, not behaviors.
track_changes
Lagging accident-report models
Traditional actuarial tables built on accident reports lag real-world driving conditions by months. By the time the data reaches your models, the road has already changed and your pricing has not.
join_inner
No road network join layer
Raw telematics event coordinates are useless without a road network to join them to. Without that join, you cannot identify which segment, curve, or intersection is generating the claim signal.
scatter_plot
Sparse claims data at scale
Claims-based models only exist where claims occurred. High-risk corridors with no reported accidents yet are invisible to your underwriting, right up until they are not.
What Is In The Dataset

104 Million Events. Road-Level Resolution.

Telematics event classification

Hard braking, sudden acceleration, and aggressive turning events are classified and geolocated, giving your models a behavior signal that accident reports will never provide until it is too late.
GPS and speed magnitude capture

Each event carries timestamped coordinates and speed or acceleration magnitude, so you can weight events by severity and build risk scores that reflect how bad a behavior was, not just that it happened.

Road-segment spatial join

Events are joinable to the road network at segment level, letting you build heatmaps by intersection, curve, or on-ramp and flag specific corridors for premium adjustment or fleet routing avoidance.

Dashcam availability flags

Video availability flags on qualifying events let claims investigators and driver coaching teams surface the footage that matters without manually scrubbing hours of recorded data.

Let's talk
Thank you! Your submission has been received!
Oops! Something went wrong while submitting the form.
done
The world's spatial data is more accessible than you think. Let's show you how close you already are.
done
You already have the questions. We have the data. Let's see what happens when they meet.
done
The where in your business is more important than you think. Let's find it together.
done
Most spatial data conversations start with a problem nobody thought was solvable. What is yours?
BigGeo AI

Ask BigGeo AI Where Your Riskiest Road Segments Are Right Now

BigGeo AI is live in ChatGPT today and shipping in Claude, giving your analysts direct plain-language access to 104 million traffic events without a GIS specialist or a data pull request. Ask which intersections in a target market generate the most hard-braking events, which corridors should trigger premium surcharges, or which routes a commercial fleet should avoid entirely. The underlying data never leaves the governed compute path, regardless of how the query is structured.

chat
Which road segments in the Dallas metro have the highest concentration of hard-braking events per mile in 2025?
chat
Show me intersections with co-occurring sudden acceleration and aggressive turning events flagged in Q1 2025 in Florida.
chat
Which highway on-ramps in our top 5 markets have risk scores above threshold and dashcam flags available?
FAQ

Frequently asked questions

How granular is the road-segment coverage? Can we actually score specific intersections, not just corridors?
add
We already have telematics coming in from our own devices. How does this dataset complement what we are collecting internally?
add
How current is the data and how often is it refreshed?
add
Do we need to build a geospatial pipeline to use this, or can our data science team access it directly?
add
What is the fastest way to evaluate whether this dataset works for our specific UBI model?
add