Vehicle Driving Events (2025) - USA

Score Every Driver on What They Actually Do

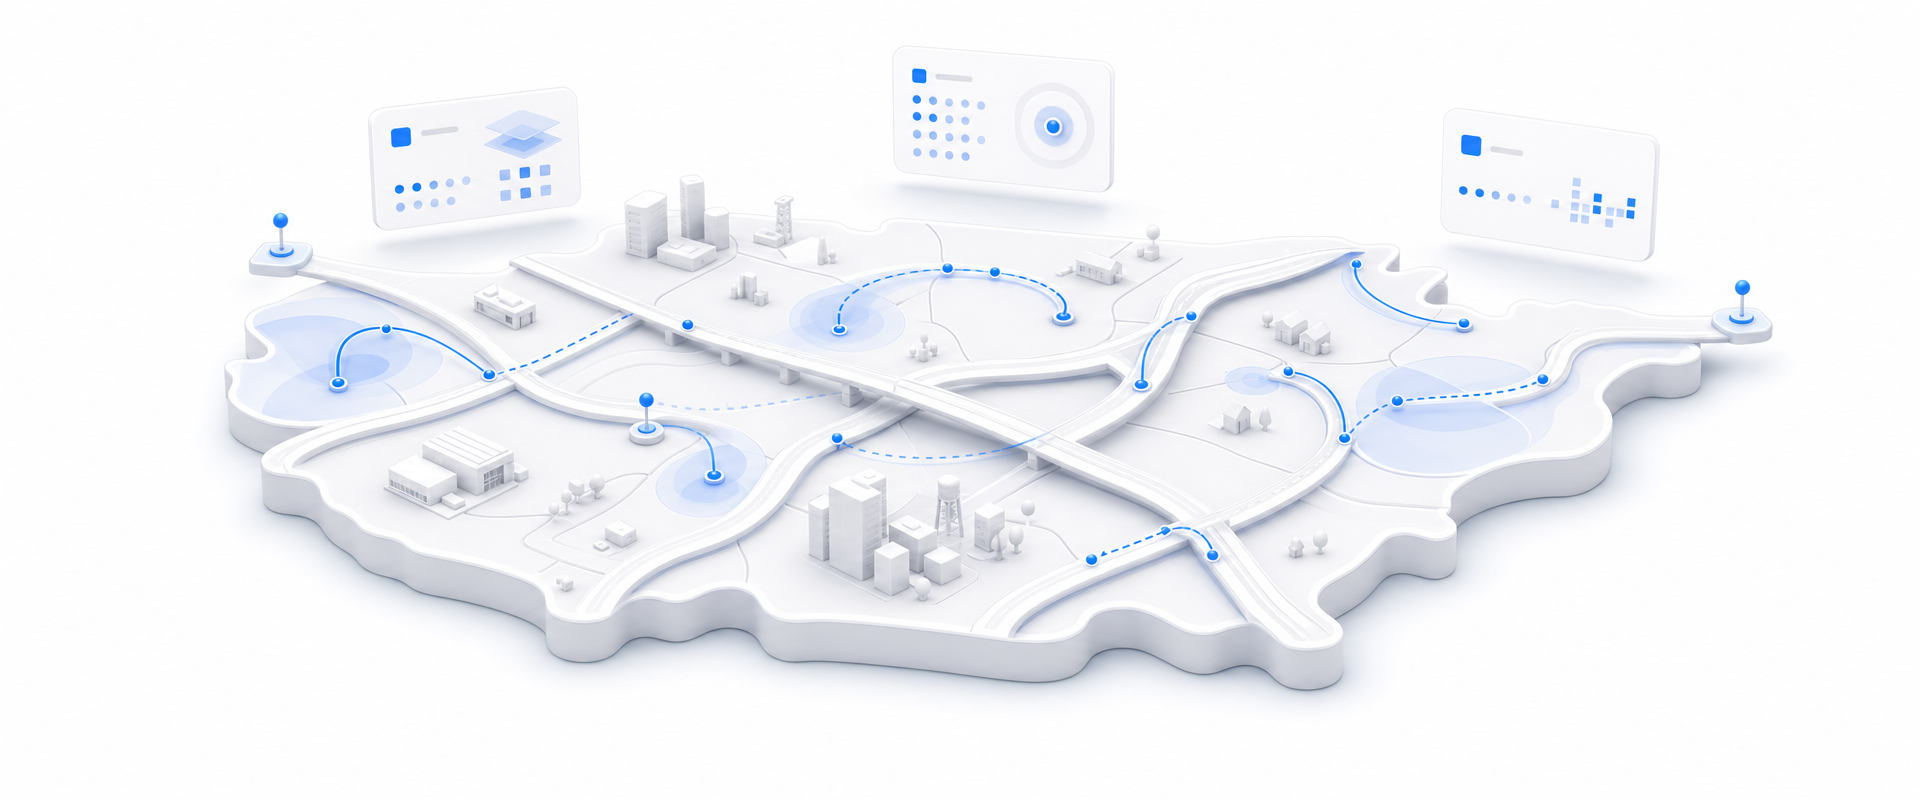
The Vehicle Driving Events dataset delivers classified acceleration, braking, turning, and eco-driving events from smartphone-based telematics across the USA, complete with motion magnitude, directional angles, and speed measurements at the event level. For the first time, your UBI models can price on observed driving behavior instead of demographic proxies, without building a data collection pipeline to get there.

Isometric white geographic platform with blue driving-event routes, markers, partitions, and floating data components representing nationwide telematics risk scoring.
At a Glance

The Data Behind the Decision

2025
Fresh, in-year telematics data
USA
Nationwide geographic coverage
6+
Key attributes per event record
Buy by Geography

Stop buying the whole country. Buy just your markets.

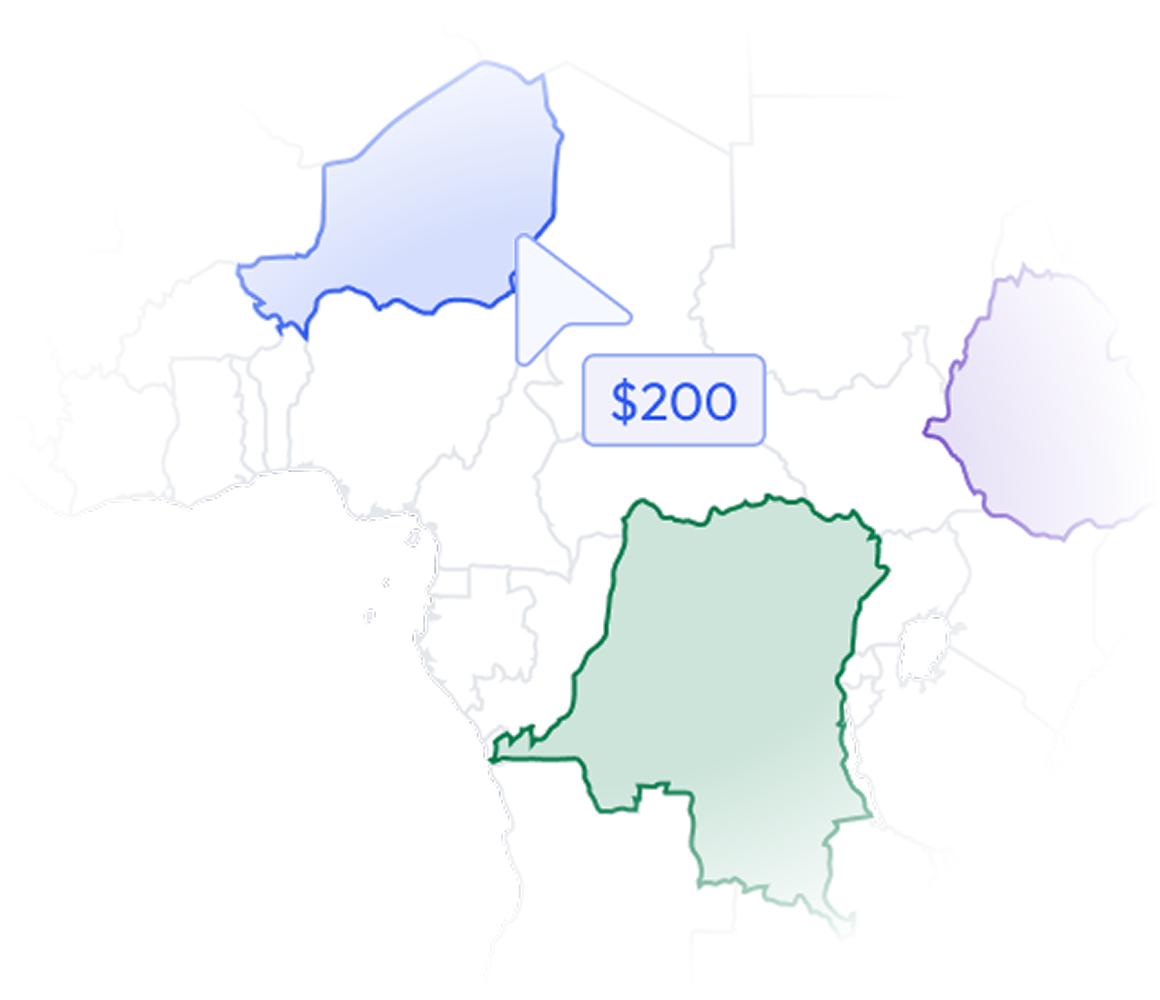
Most data vendors sell you a national license to millions of records you will never contact. BigGeo works differently.You tell us where you sell, and we cut you exactly that geographic slice of the dataset. A single city.

A cluster of ZIP codes. A metro area. A county. Whatever matches your territory. The result is a lean, CRM-ready file containing only the companies in the markets you actually work, delivered at a fraction of the cost of a full national license.

Book a Meeting

See Your Risk Model Fed Real Data

The Problem

Proxy Signals Are Destroying Your Loss Ratio

Auto insurers know that zip code, credit score, and vehicle age are weak proxies for how someone actually drives. The UBI promise has always been pricing on real behavior. The gap between that promise and what most teams can actually execute on comes down to one thing: access to clean, structured, event-level telematics data at scale. Without it, your risk models are still guessing.

search
Behavioral Data Is Hard to Source
Building a telematics collection program from scratch requires hardware, mobile SDK partnerships, and years of data accumulation. Most insurers end up with thin, proprietary datasets that cannot support statistically robust risk segmentation.
rule
Event Classification Is Inconsistent
Raw accelerometer signals mean nothing until they are classified, normalized, and attributed to a specific maneuver. Inconsistent event definitions across data sources make model training unstable and comparisons across cohorts unreliable.
location_on
No Spatial Context on Risk Events
Knowing a hard brake happened tells you little. Knowing it happened at a specific intersection, at a specific speed, during a turning maneuver with a measurable directional angle tells you everything your risk model needs to act on.
analytics
Scoring Pipelines Built on Thin Samples
Per-driver risk scores require sufficient event volume per mile driven to be statistically meaningful. Models built on sparse event logs produce noisy scores that erode actuarial confidence and make premium segmentation difficult to defend.
What Is In The Dataset

Every Driving Event, Fully Attributed and Ready

Classified Event Types, Ready to Score

Every record is pre-classified as acceleration, braking, turning, or eco-driving. Skip the signal processing work and go directly to building frequency-per-mile risk features your actuarial team can use today.

Start and End Speed per Event

Speed measurements at the beginning and end of each event let you calculate velocity delta, a core variable for distinguishing aggressive maneuvers from normal driving and calibrating the magnitude of surcharge triggers.

Directional Angles on Every Turn

Turning events include the directional angle of the maneuver, giving your model the ability to separate sharp, high-risk cornering from gradual turns and assign differentiated risk weight accordingly.

Spatially Referenced Event Coordinates

Start and end coordinates on every event mean you can join driving behavior to road type, speed limit, intersection density, or weather exposure, unlocking the geographic risk layering that flat telematics files cannot support.

Let's talk
Thank you! Your submission has been received!
Oops! Something went wrong while submitting the form.
done
The world's spatial data is more accessible than you think. Let's show you how close you already are.
done
You already have the questions. We have the data. Let's see what happens when they meet.
done
The where in your business is more important than you think. Let's find it together.
done
Most spatial data conversations start with a problem nobody thought was solvable. What is yours?
BigGeo AI

Ask Your Riskiest Driving Questions in Plain Language, Get Governed Answers

BigGeo AI is live in ChatGPT today and shipping in Claude, giving your team direct access to governed driving event data through the tools they already use. Instead of waiting on a GIS analyst to pull event clusters by region, your actuary or product manager can ask which corridors concentrate the highest hard-braking frequency and get a spatially grounded answer in seconds, backed by real 2025 data, not a model hallucination. No GIS software. No data pipeline. No waiting.

chat
Show me the counties with the highest hard-braking event rate per mile driven in 2025.
chat
Which turning events exceeded 45 degrees with entry speeds above 35 mph in urban ZIP codes?
chat
Compare acceleration event frequency per driver cohort across metro versus rural coverage areas.
FAQ

Frequently asked questions

Is this data collected with driver consent and appropriate permissions?
add
How do I know there are enough events per driver to build statistically meaningful risk scores?
add
How fresh is the data and how often is it updated?
add
How does this data get into our existing infrastructure?
add
We have never used BigGeo before. What does getting started actually look like?
add