
European Municipality Demographics 2026

Score Every European Market Before Your Competitors Do

European Municipality Demographics 2026 delivers harmonized population, density, and boundary data for 43 countries in a single spatially-indexed dataset, purpose-built for retail site selection and market entry. For the first time, you can rank and filter every municipality across Europe by the exact demographic criteria your business case requires, without touching a single national statistics portal.
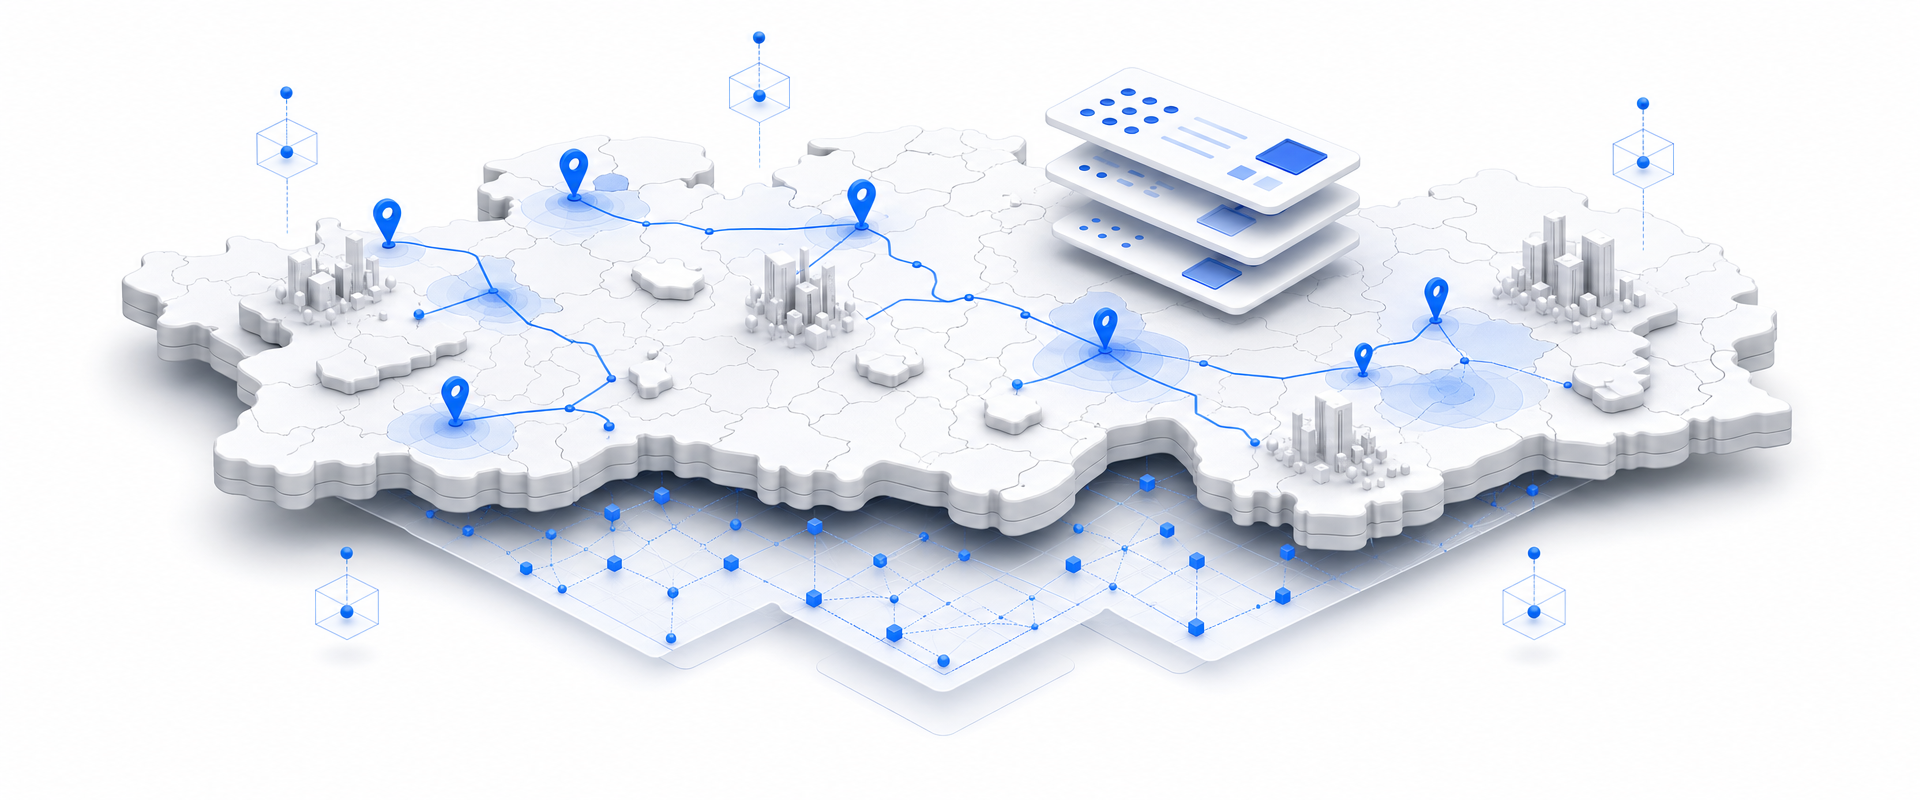
Isometric matte-white geographic platform with blue routes, markers, boundary regions, and floating data layers representing harmonized European municipality demographics.
At a Glance

The Data Behind the Decision

43
Countries in one dataset
WGS84
Spatially ready coordinates
2026
OpenStreetMap boundary vintage
Buy by Geography

Stop buying the whole country. Buy just your markets.

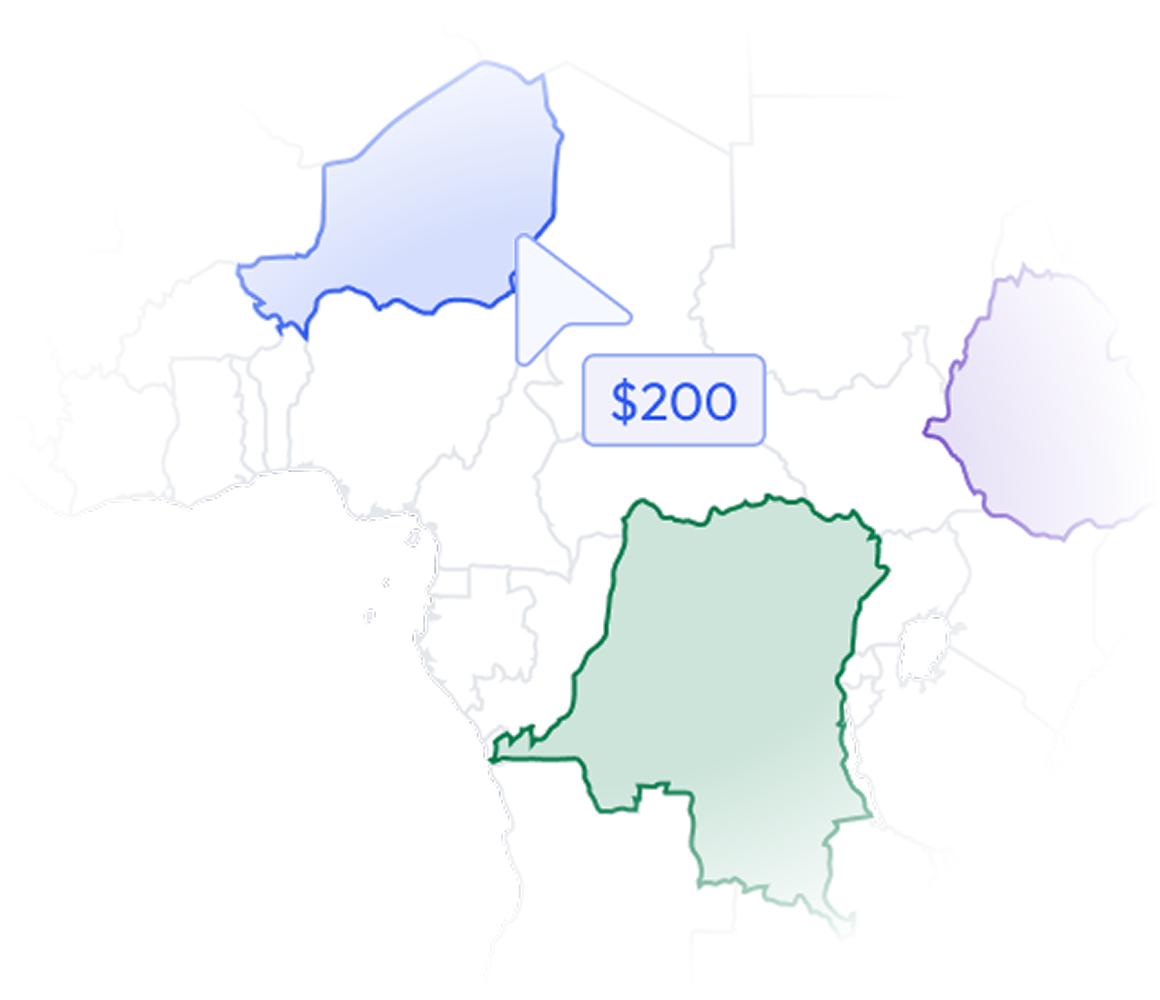
Most data vendors sell you a national license to millions of records you will never contact. BigGeo works differently.You tell us where you sell, and we cut you exactly that geographic slice of the dataset. A single city.

A cluster of ZIP codes. A metro area. A county. Whatever matches your territory. The result is a lean, CRM-ready file containing only the companies in the markets you actually work, delivered at a fraction of the cost of a full national license.
Book a Meeting

See Your Expansion Markets in 30 Minutes

The Problem

Patching National Data Is Killing Your Timeline

European expansion decisions are being made on demographic data that was never designed to work together. Every national statistics office has its own boundary vintage, its own population reference year, its own file format, and its own definition of what a municipality even is. By the time your team reconciles it all, the site window has closed or the business case has lost credibility with the board.

layers
Fragmented Cross-Country Data Sources
Pulling population data from INSEE, Destatis, INE, and a dozen other national portals means your team spends weeks on data assembly before a single market has been scored. That delay is not a process problem, it is a competitive liability.
warning
Incompatible Boundary and Vintage Mismatches
When boundary polygons from one country reflect 2019 administrative divisions and population counts from another reflect 2022 registrations, every cross-country comparison is structurally flawed. Site scoring built on mismatched geographies produces recommendations that cannot survive scrutiny.
filter_alt
No Working-Age or Age-Band Visibility
Total population is not a proxy for demand. A municipality with 80,000 residents dominated by retirees looks identical to one with 80,000 working-age consumers until you look at the age breakdown, which most patchwork datasets do not include at municipal resolution.
query_stats
GIS Bottleneck on Every Market Question
Every time a real estate or strategy team needs a proximity or density query, it goes into the GIS analyst queue and comes back days later, often with caveats about data quality. That bottleneck slows decisions and limits how many markets you can realistically evaluate.
What Is In The Dataset

One Dataset. Every European Municipality. Decision-Ready.

Harmonized Municipal Boundaries

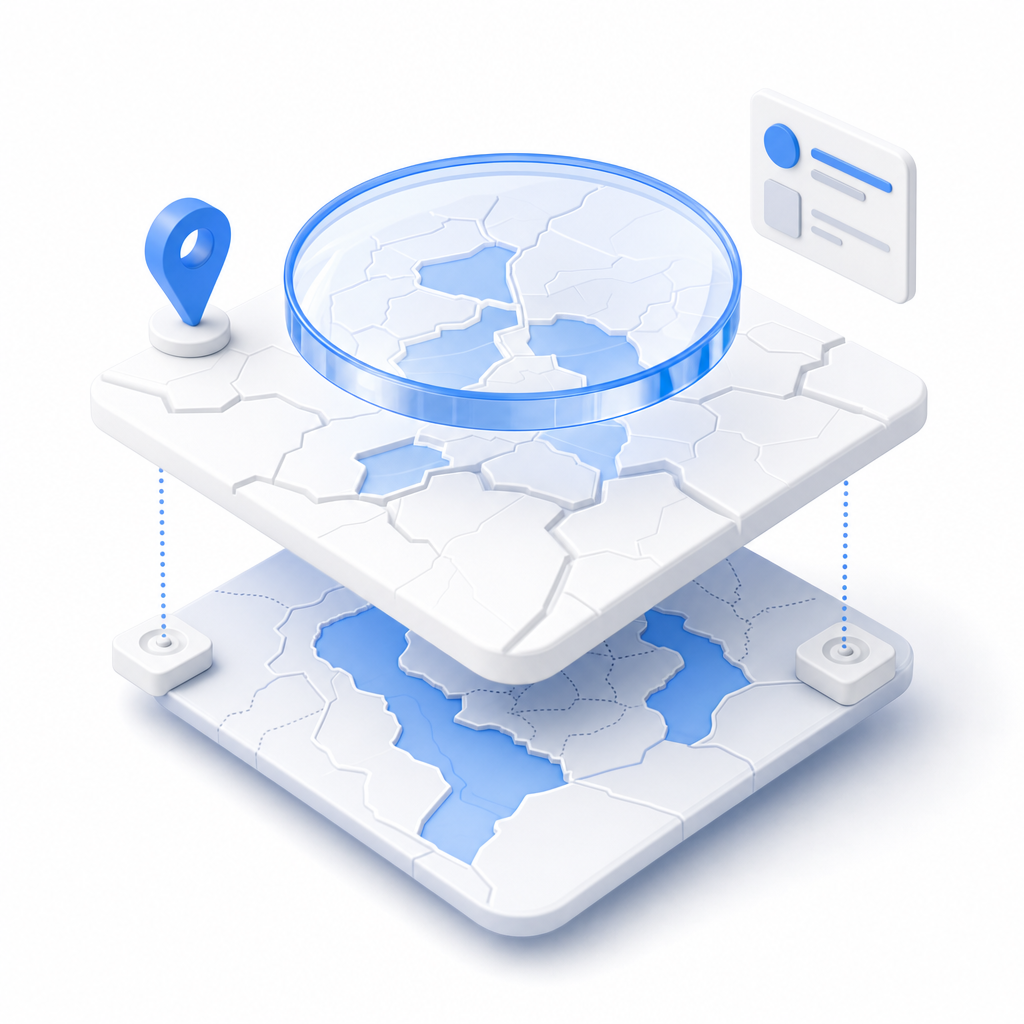
Every municipality boundary is delivered in WGS84 coordinates from a single 2026 OpenStreetMap vintage, so your cross-country comparisons are structurally consistent. Filter by region, country, or draw a custom trade area and instantly know which municipalities fall inside it.
Age-Band Population Breakdowns

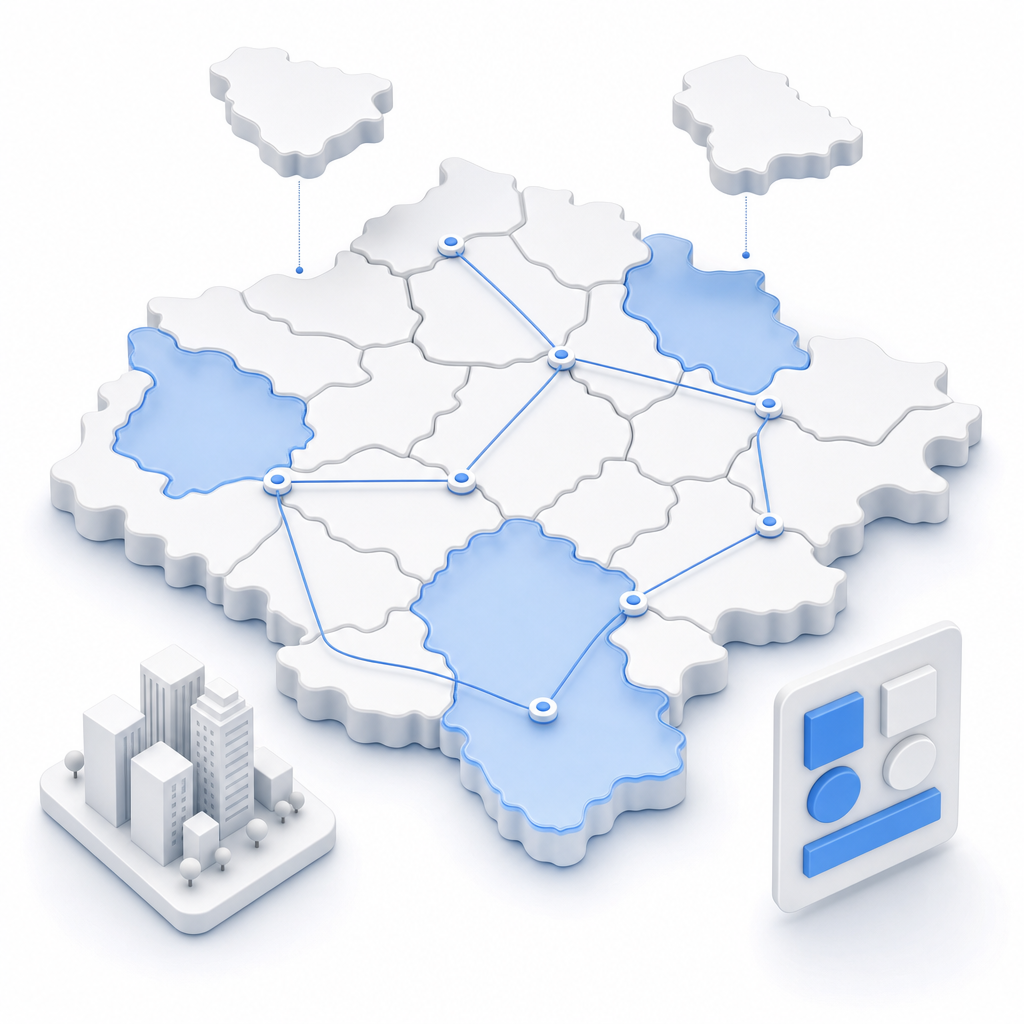
Children, working-age adults, and seniors are broken out at the municipal level for every country in the dataset. Score markets by the specific consumer cohort your product targets, not by blunt total-population figures that mask the actual opportunity.
Population Density at Municipal Scale

Land area and derived population density metrics let you distinguish between a large rural municipality and a dense urban core with identical total populations. Density is the variable that separates a viable store location from an expensive underperformer.

EU, Eurozone, and Balkan Country Flags

Country membership flags let you filter your market universe instantly by regulatory and economic grouping. Prioritize EU-only markets for a phased entry strategy, or expand your scope to include Balkan candidates without rebuilding your filter logic from scratch.

Let's talk
Thank you! Your submission has been received!
Oops! Something went wrong while submitting the form.
done
The world's spatial data is more accessible than you think. Let's show you how close you already are.
done
You already have the questions. We have the data. Let's see what happens when they meet.
done
The where in your business is more important than you think. Let's find it together.
done
Most spatial data conversations start with a problem nobody thought was solvable. What is yours?
BigGeo AI

Ask Any European Market Question in Plain Language and Get a Governed Answer

BigGeo AI is live in ChatGPT today and available in Claude, connecting your plain language questions directly to governed, real data from European Municipality Demographics 2026. Instead of waiting for a GIS analyst to run a density filter across five countries, you type the question yourself and get a grounded answer in seconds, with no GIS software and no data pipeline. The underlying data never leaves the governed compute path regardless of how you access it.

chat
Which municipalities in Poland have over 40,000 working-age residents and a population density above 500 per square kilometer?
chat
Show me the top 20 municipalities in France and Spain ranked by total population within 50km of an existing store location.
chat
Which EU-member municipalities in the Balkans have a working-age population share above 60 percent and total population over 25,000?
FAQ

Frequently asked questions

Is this dataset actually harmonized across all 43 countries, or are there gaps I will have to fill in?
add
We already have some European demographic data internally. How does this improve on what we have?
add
How current are the population figures, and how often is the dataset updated?
add
How do we actually get this into our existing tools and workflows?
add
What does getting started actually look like? We do not want a six-week onboarding process.
add