
Ask any location question. Get a real answer. That is it.
NielsenIQ location data delivers hyperlocal consumer spending signals, retail performance benchmarks, and demographic purchasing profiles — so your team makes confident decisions faster.
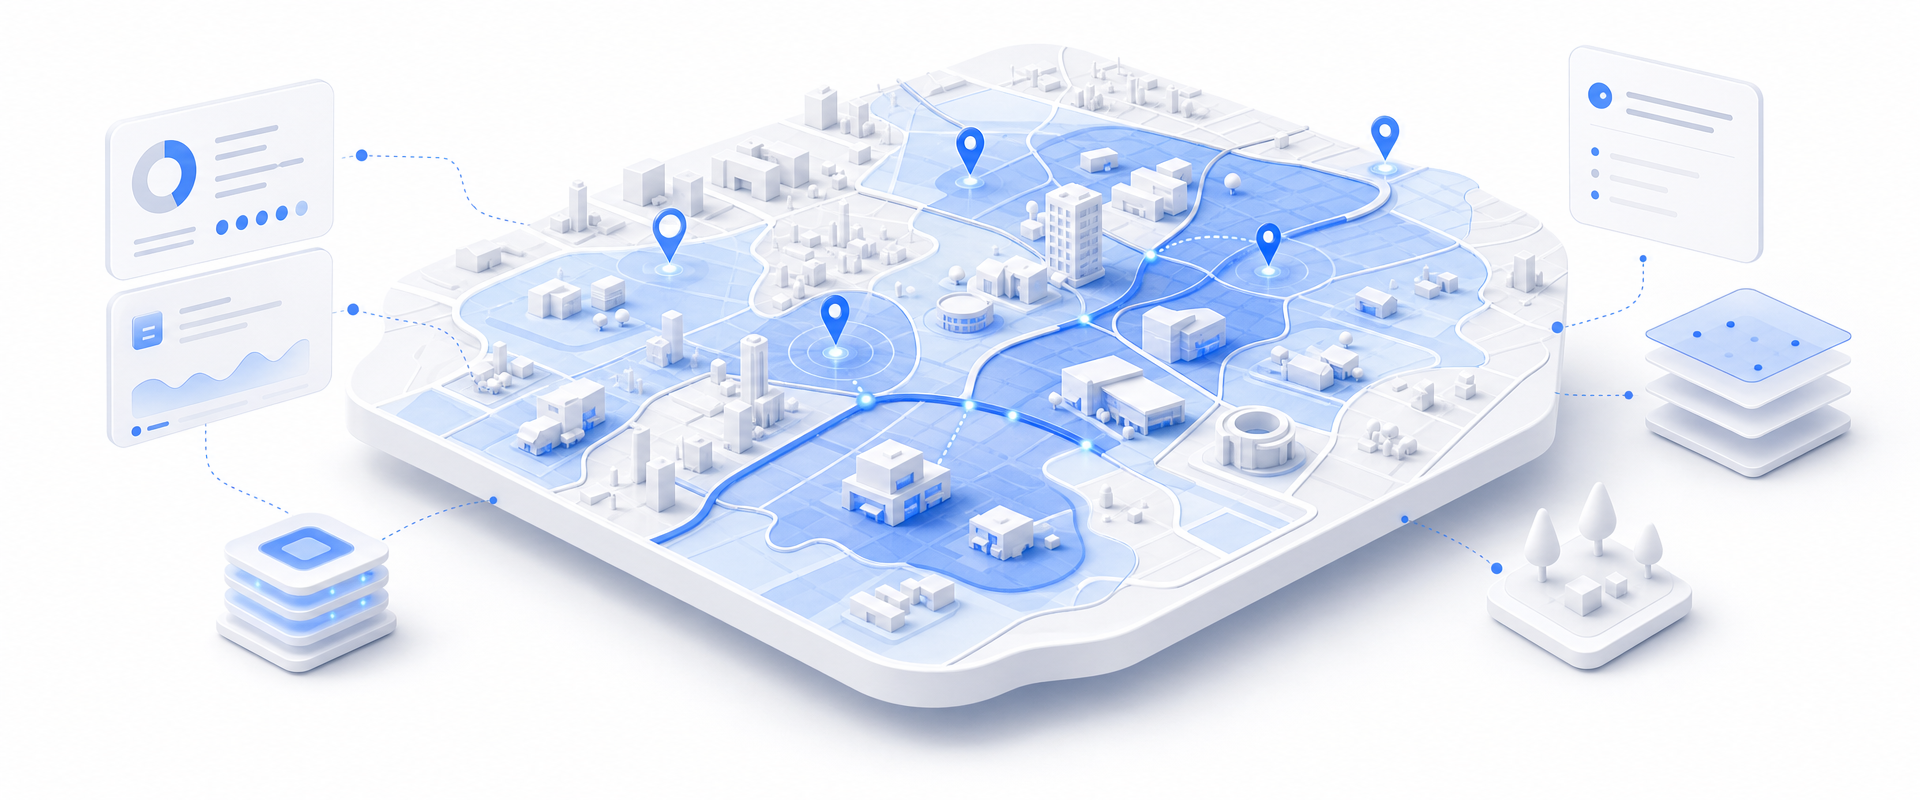
Most data vendors sell you a national license to millions of records you will never contact. BigGeo works differently. You tell us where you sell, and we cut you exactly that geographic slice of the dataset. A single city.
A cluster of ZIP codes. A metro area. A county. Whatever matches your territory. The result is a lean, CRM-ready file containing only the companies in the markets you actually work, delivered at a fraction of the cost of a full national license.
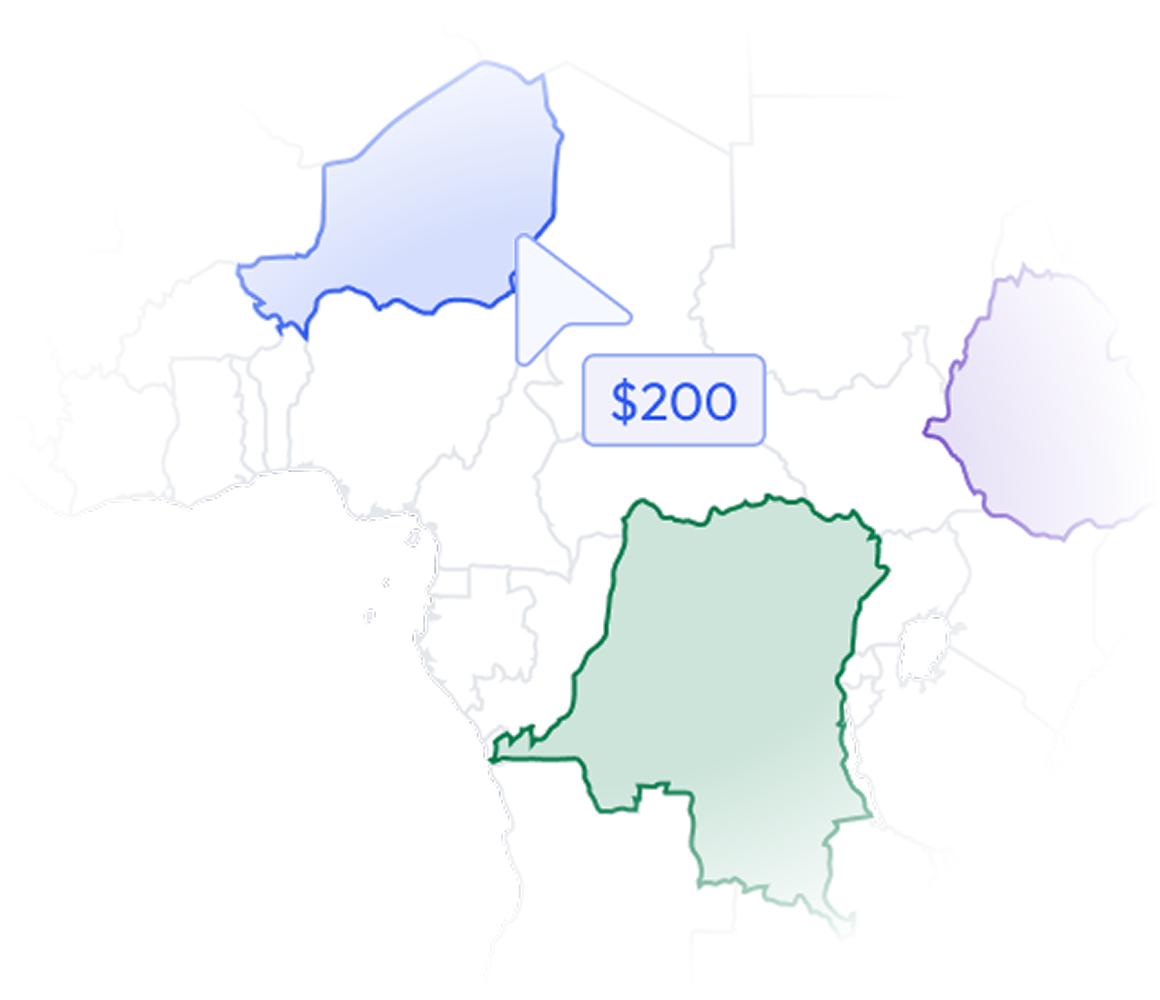
Site selectors, brand strategists, and retail operators are under pressure to grow — but fragmented, outdated, or surface-level consumer data leads to costly misses in the field.
Measure consumer spending propensity across 100+ product and service categories at the ZIP, census tract, and block group level — normalized against national benchmarks for apples-to-apples comparisons.
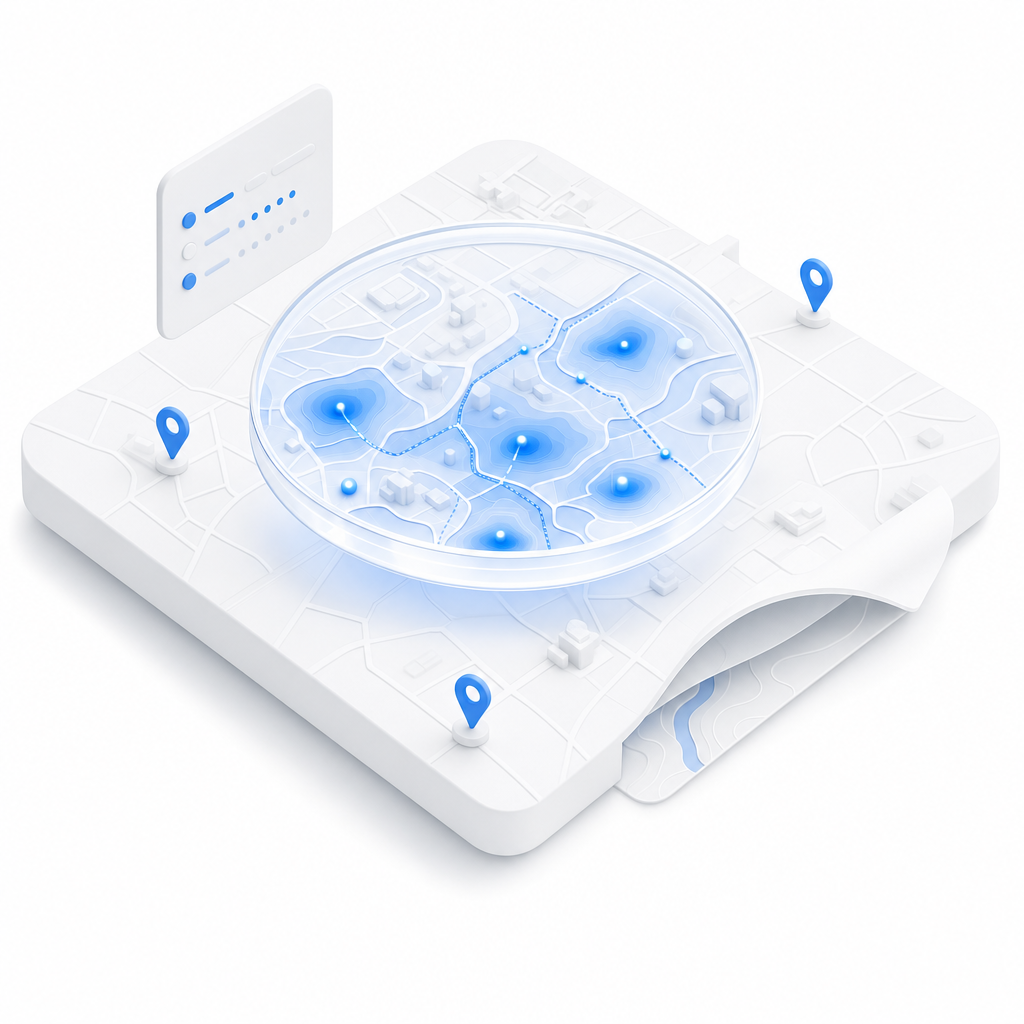
Quantify addressable demand within any custom trade area using NielsenIQ's purchasing power estimates, household penetration rates, and category spend per capita.
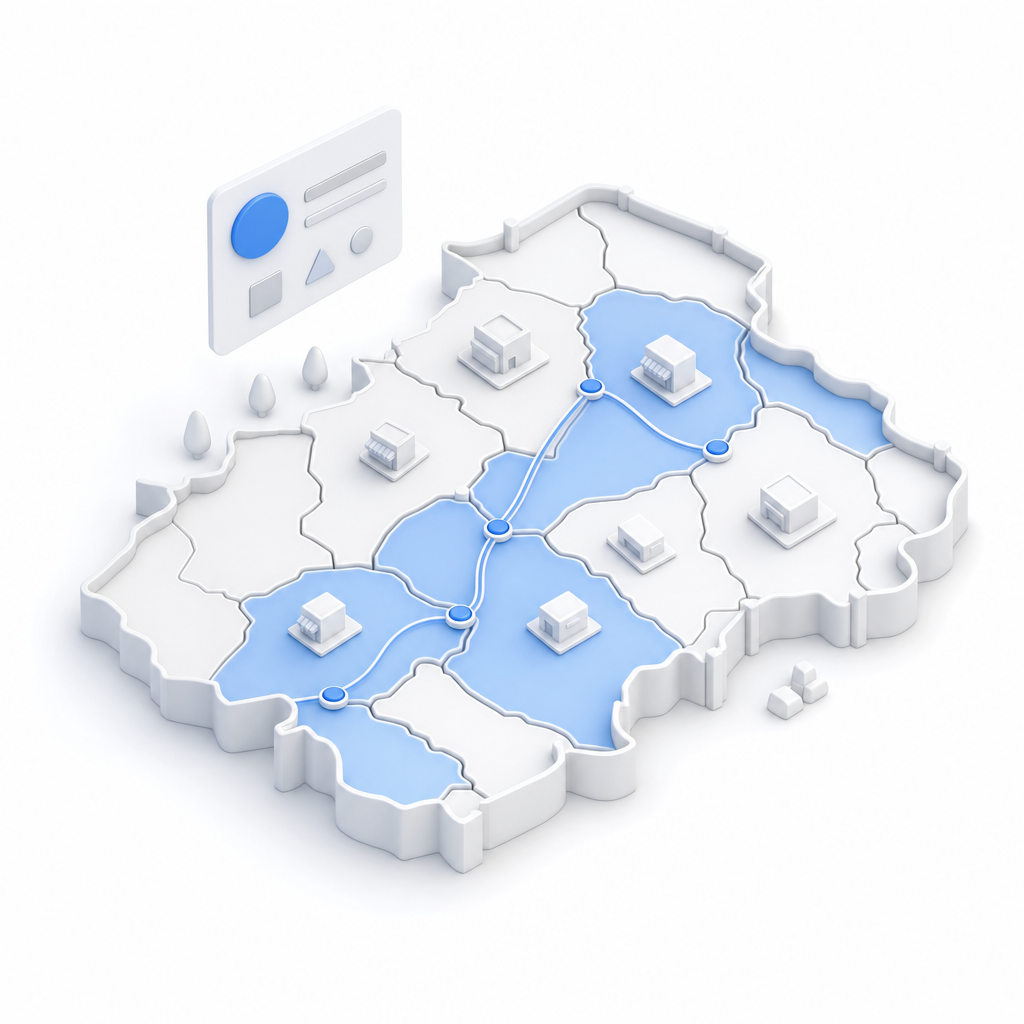
Compare prospective locations against top-performing stores in your portfolio using NielsenIQ's retail sales velocity and consumer basket data — before you sign a lease.
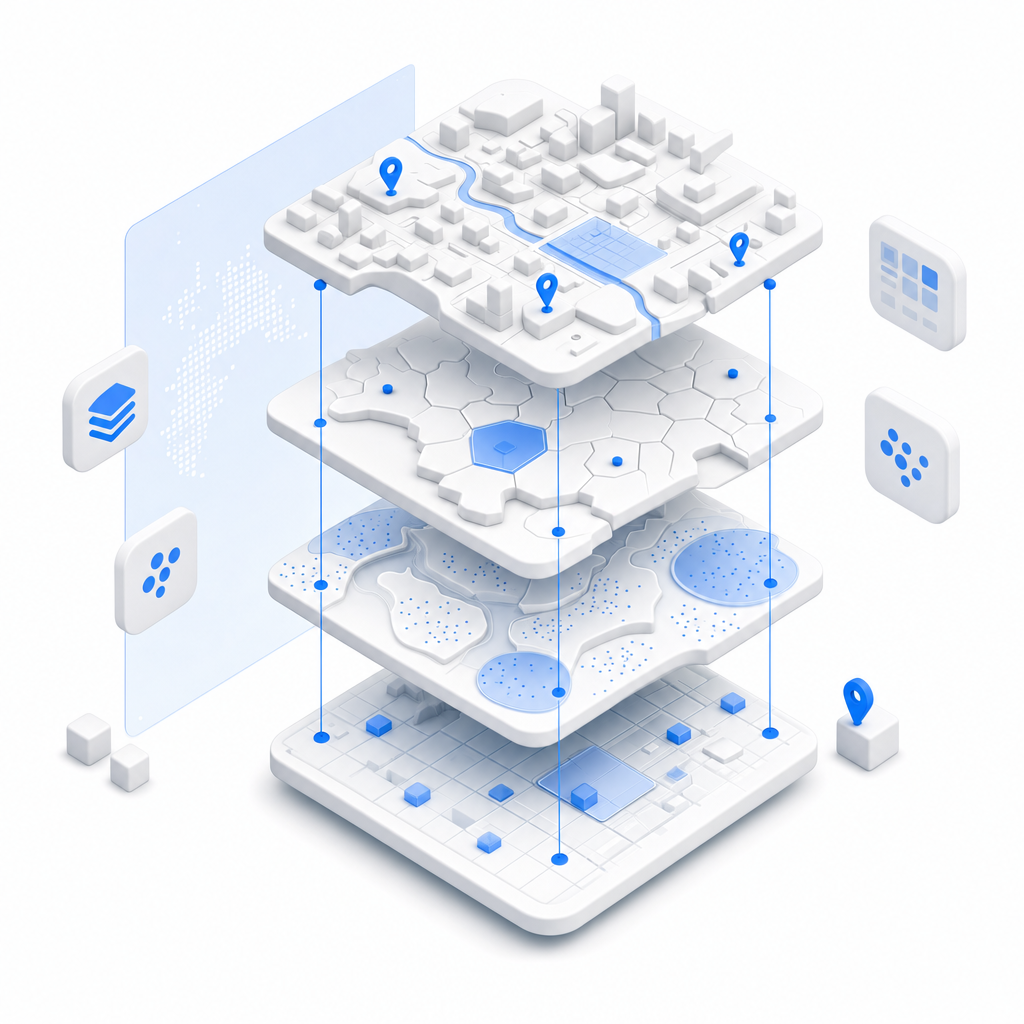
Identify where competing brands are capturing spend in your target categories and surface whitespace opportunities where consumer demand is unmet by existing supply.
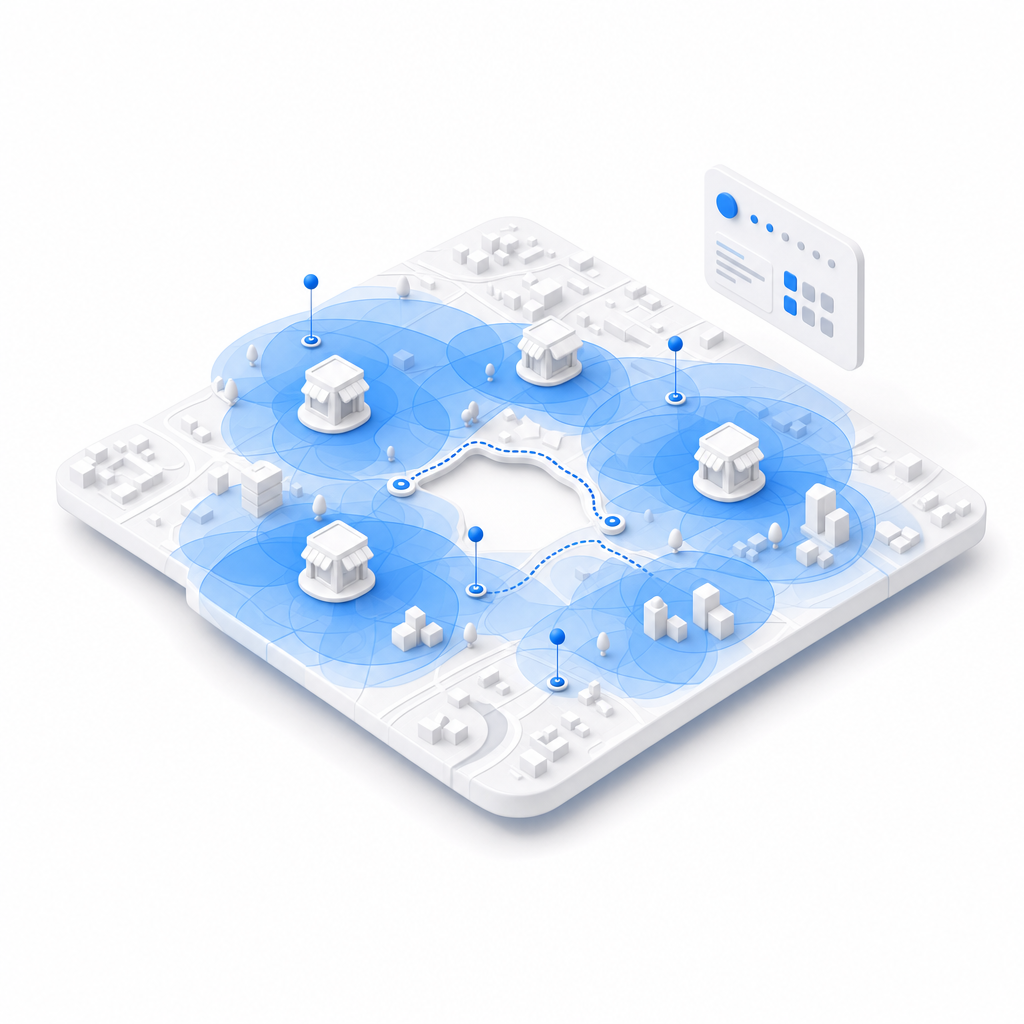
Spatial's AI layer puts NielsenIQ's consumer intelligence at the fingertips of every analyst, strategist, and operator on your team — no SQL, no data science degree required.